Us Women Infographic
- Class: Digital Imagery in Web Design
- Scope: Infographic
- Technologies: Photoshop
- Year: 2014
Description:
 For my Photoshop class,we were asked to make an infographic from one of two webpages. Either The US Falls Behind Nicaragua, Rwanda, And The Philippines On Women’s Equality or 8 Food Myths You Probably Believe. I chose the women’s equality article as it had more statistics. This project was for class and I’m not affiliated with the article’s authors.
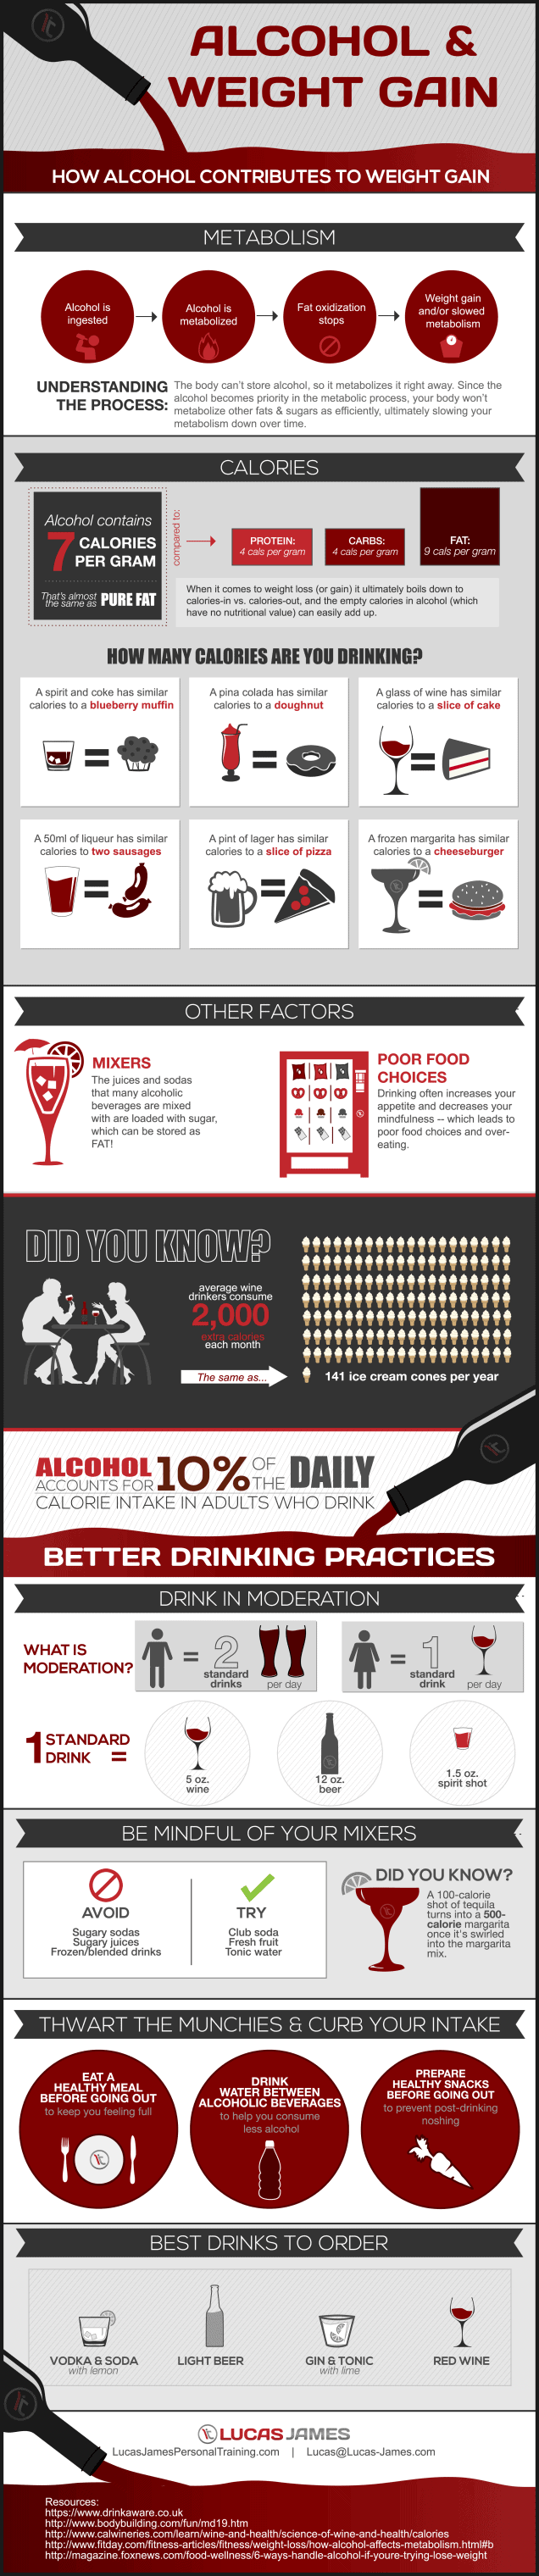
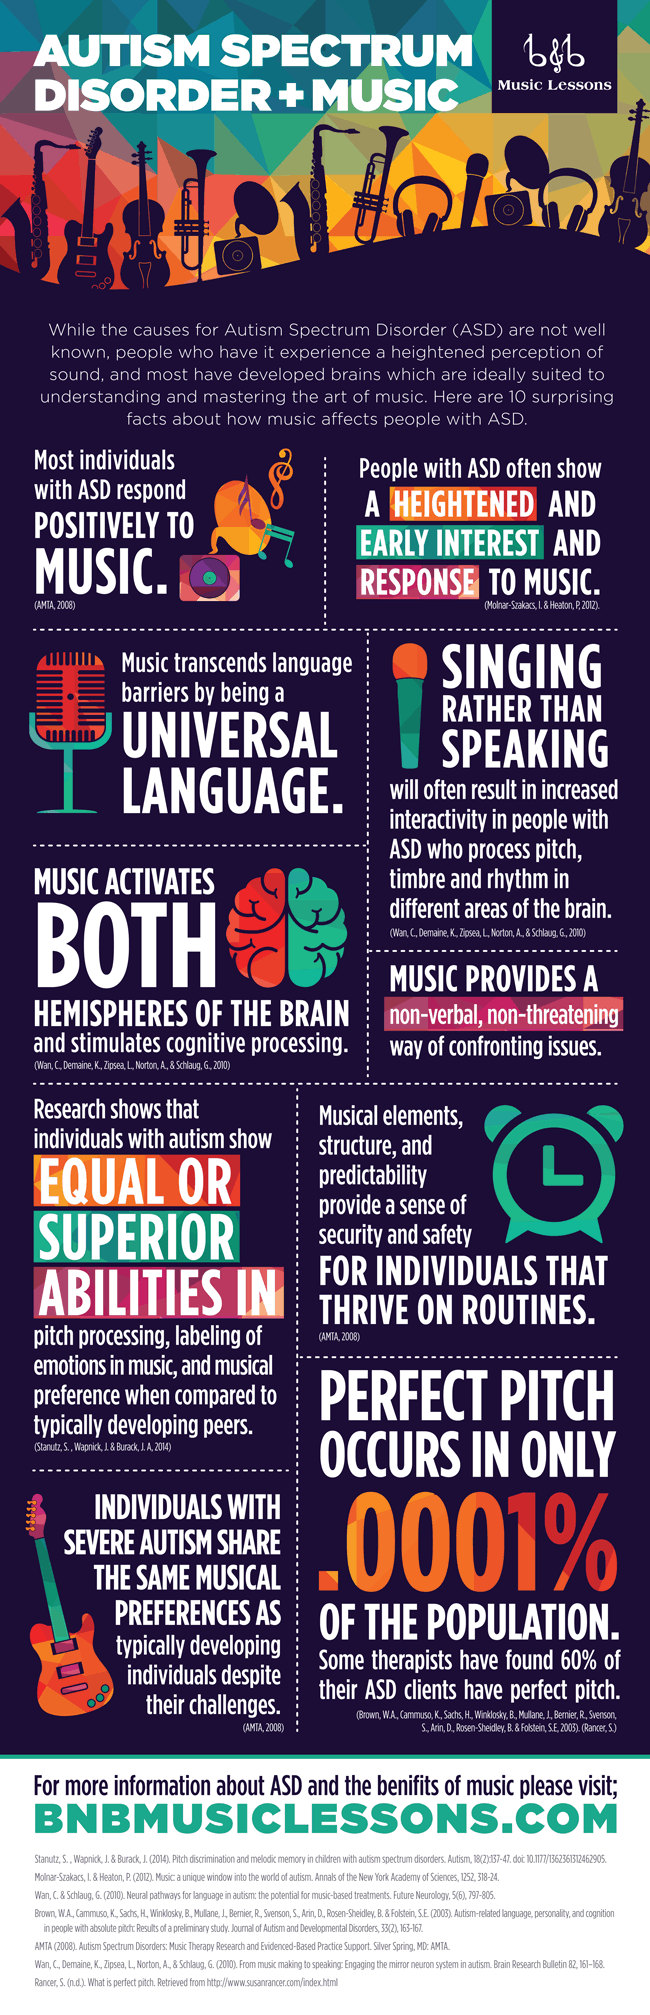
For this infographic, I searched for data with a common thread, which I could turn into a visual story. I found a lot of statistics, and I arranged them in an order that would ease the viewer into the hard spots. I hoped that doing so would convey the lack of female representation in certain sectors. To get inspiration I searched through http://dailyinfographic.com and found two that stuck out to me: Alcohol and Weight Gain and Autism Spectrum Disorder & Music.
I started by taking the stats that I found, and sketching some thoughts. Next, I created a rough character to use and roughed out the scenes with place holder text/images, etc. Then I searched for photos, and repeated the steps refining along the way. Towards the end, I tweaked the character to be unique in each scene, added drop shadows and subtle gradients to the headline boxes. The last steps were adding the citations, and my logo/website.